Every method,
drawn.
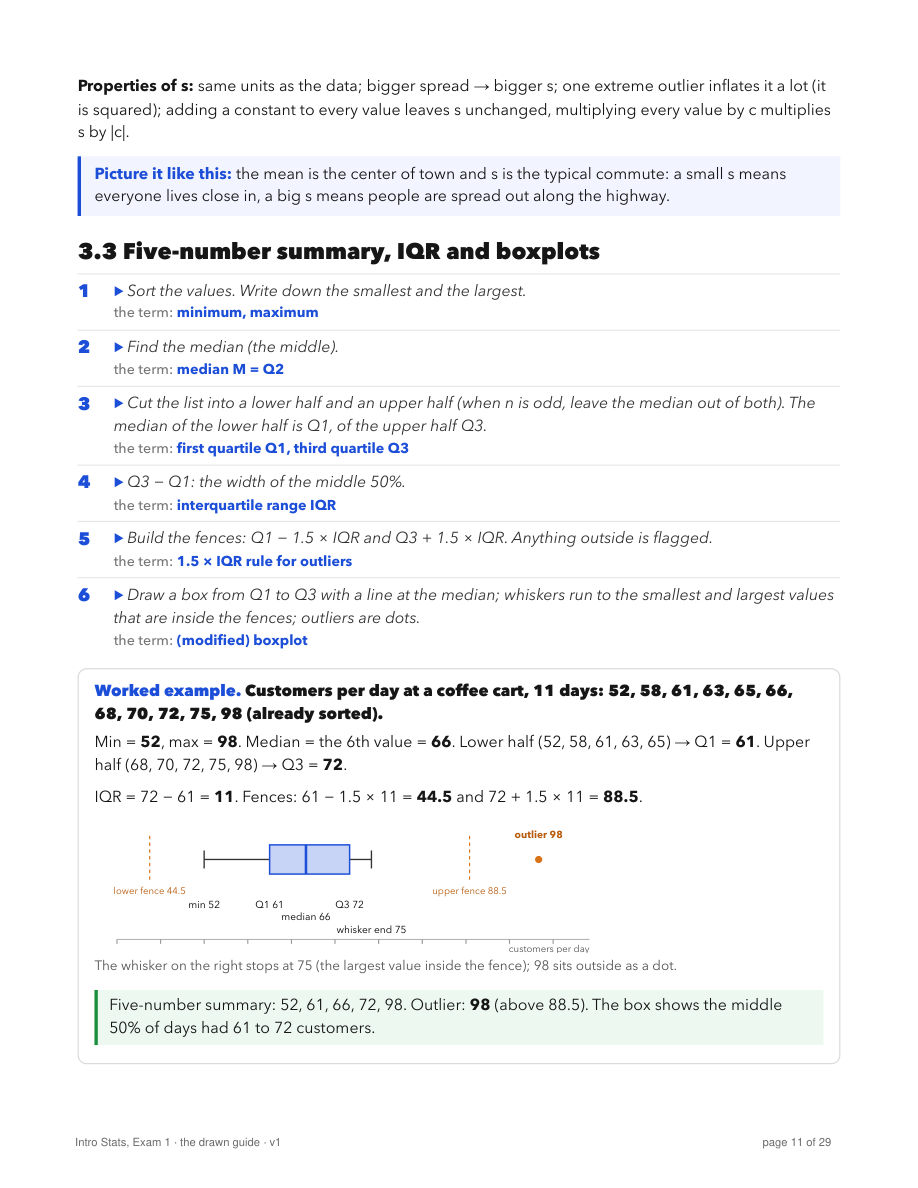
Customers per day at a coffee cart
Your exam wants a boxplot. Scroll and watch the guide's six steps build one.
Step 1 of 6
Smallest to largest. Write down the minimum and the maximum.
Step 2 of 6
The middle value. With 11 numbers, it's the 6th.
Step 3 of 6
Cut the list in half and leave the median out. The middle of each half.
Step 4 of 6
72 − 61. That's the box: the middle half of the days.
Step 5 of 6
1.5 × IQR out from each side of the box: 44.5 and 88.5.
Step 6 of 6
It's past the fence, so it's an outlier: a dot. The whisker stops at 75, the last value inside.
That was page 11 of 29
Numbered steps, the term under each one, a worked example and the trap the exam sets.
Scroll
Study guide · 4 PDFs · one time, US$15
A 29-page guide (data and sampling, graphs, center and spread, z-scores, correlation and regression), a one-page formula sheet, a 50-minute mock exam and its worked key, plus the calculator key presses for the TI-84 and TI-Nspire.
Written from scratch, not tied to any school or professor. Read 4 free pages.
Paste a list from your homework. The same six steps run on it, worked out the way the guide does them by hand.
Quartiles by the halves method, the one the TI-84 uses and most intro courses teach. Spreadsheets and some textbooks can give a slightly different Q1 and Q3; the guide flags it. Nothing you type leaves this page.
Most intro stats courses open with the same block before the first exam. Tick it against your syllabus:
Not in this guide: probability rules, random variables, the normal table (z-table) and sampling distributions. In most courses those are Exam 2. If your Exam 1 includes them, this guide covers only part of it.
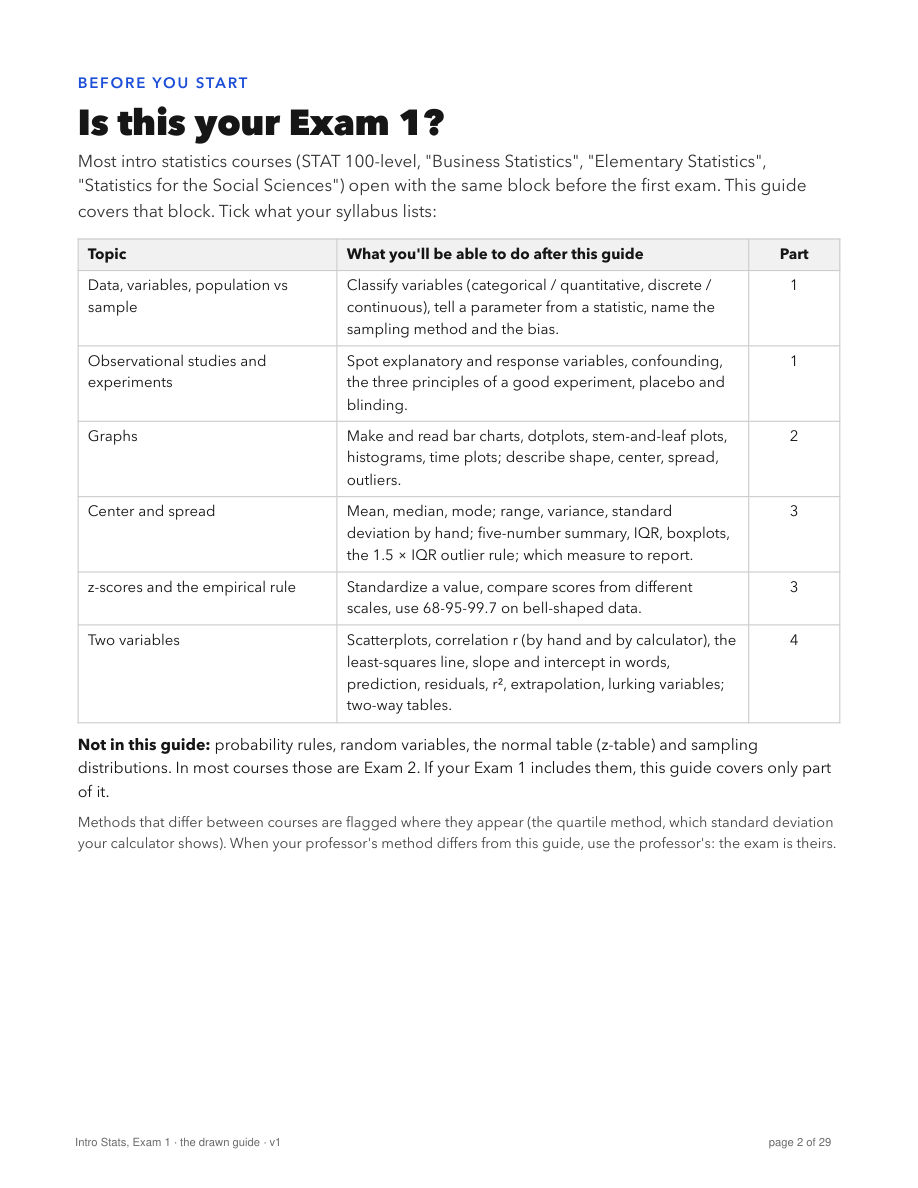
Every picture is a page of the guide, exactly as it is in the PDF.
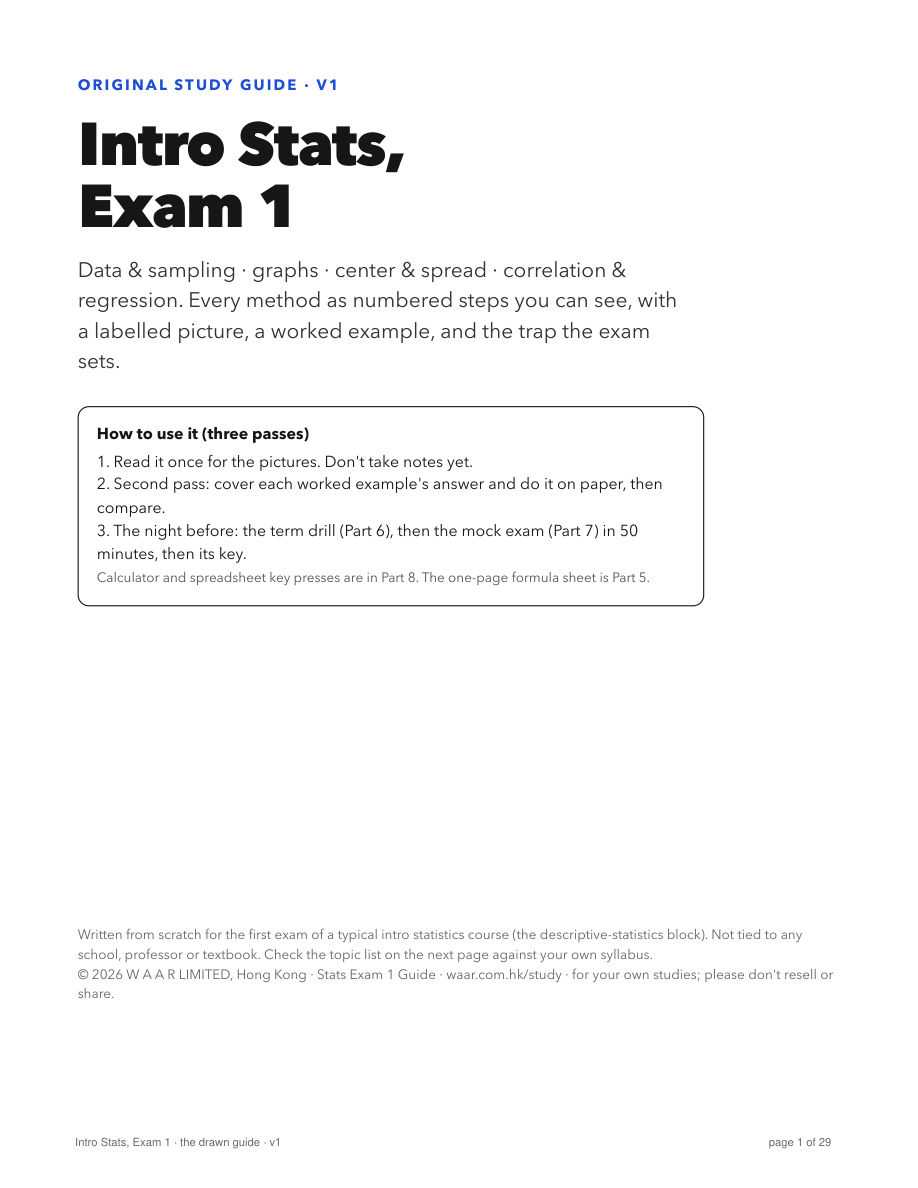
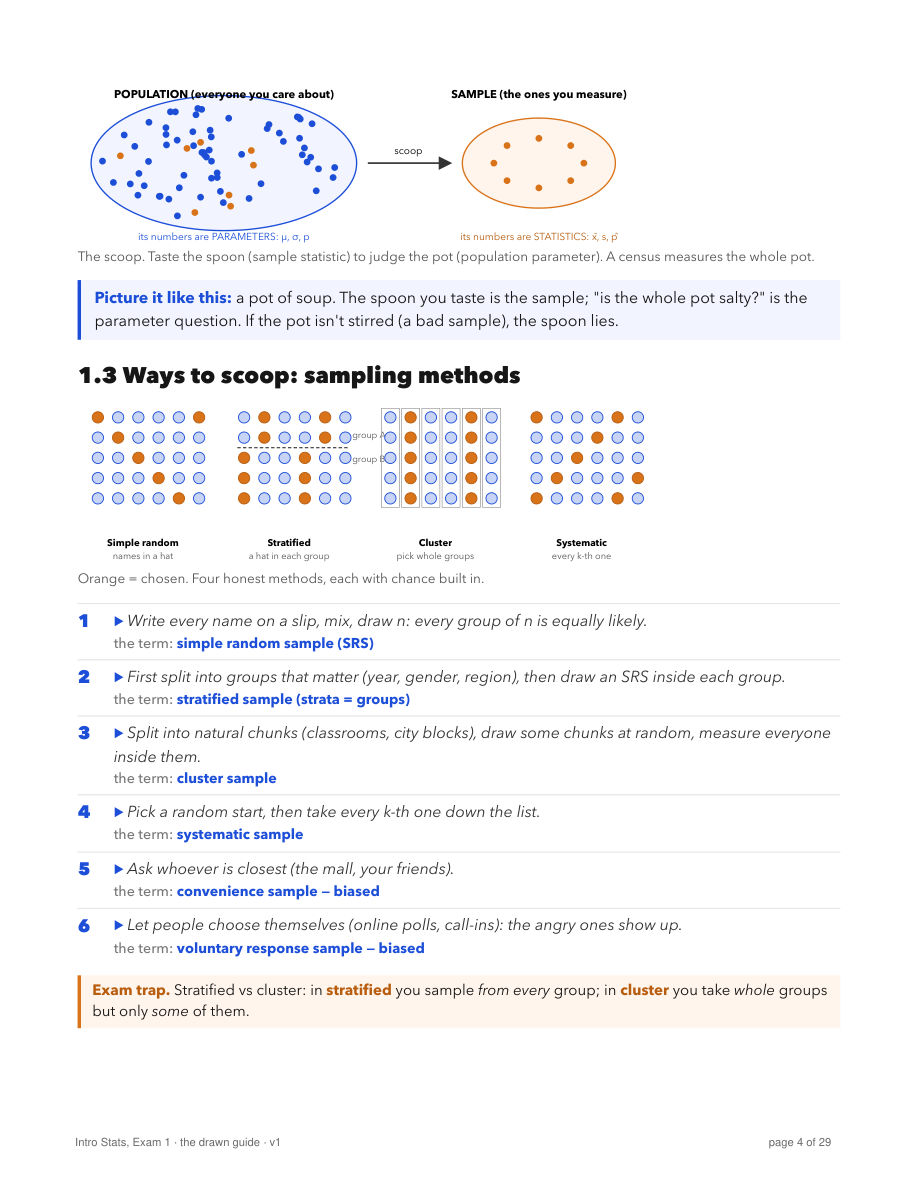
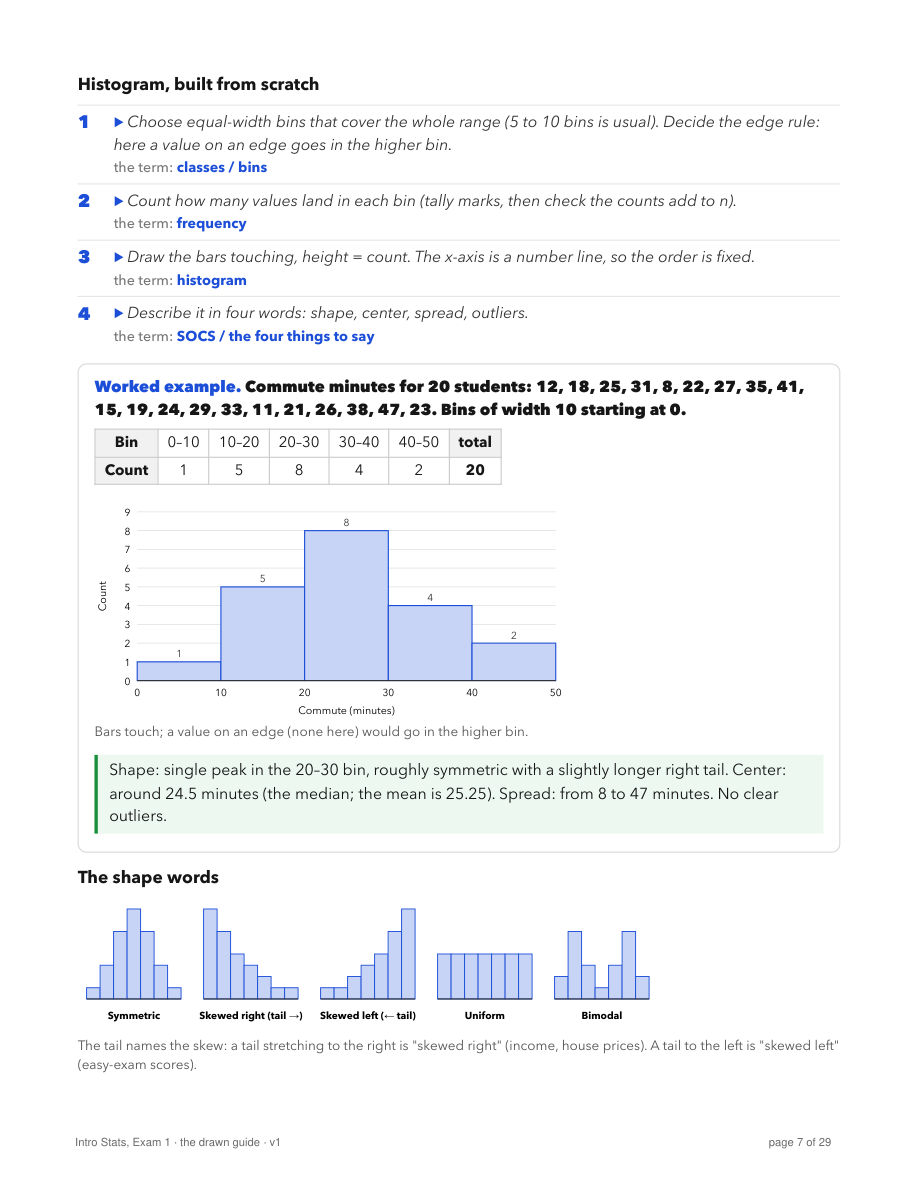
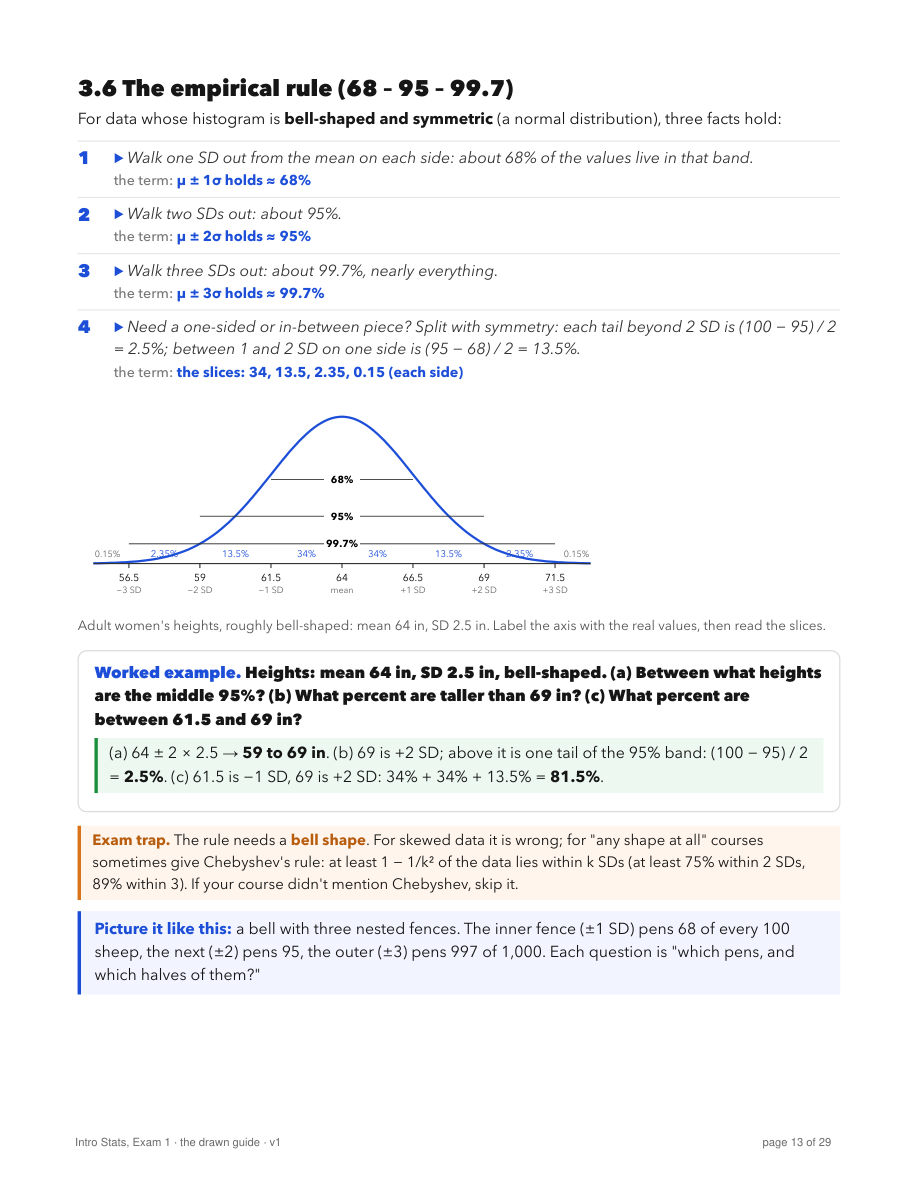
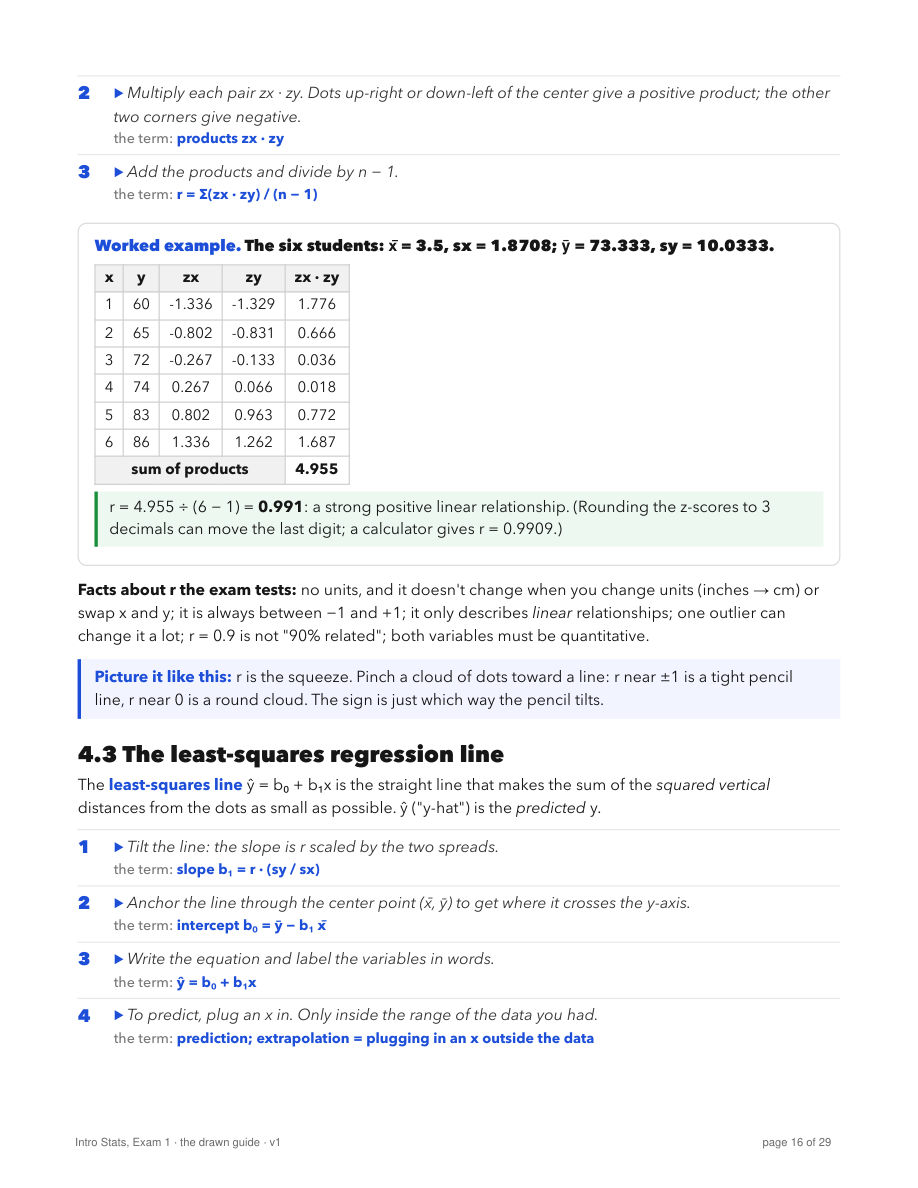
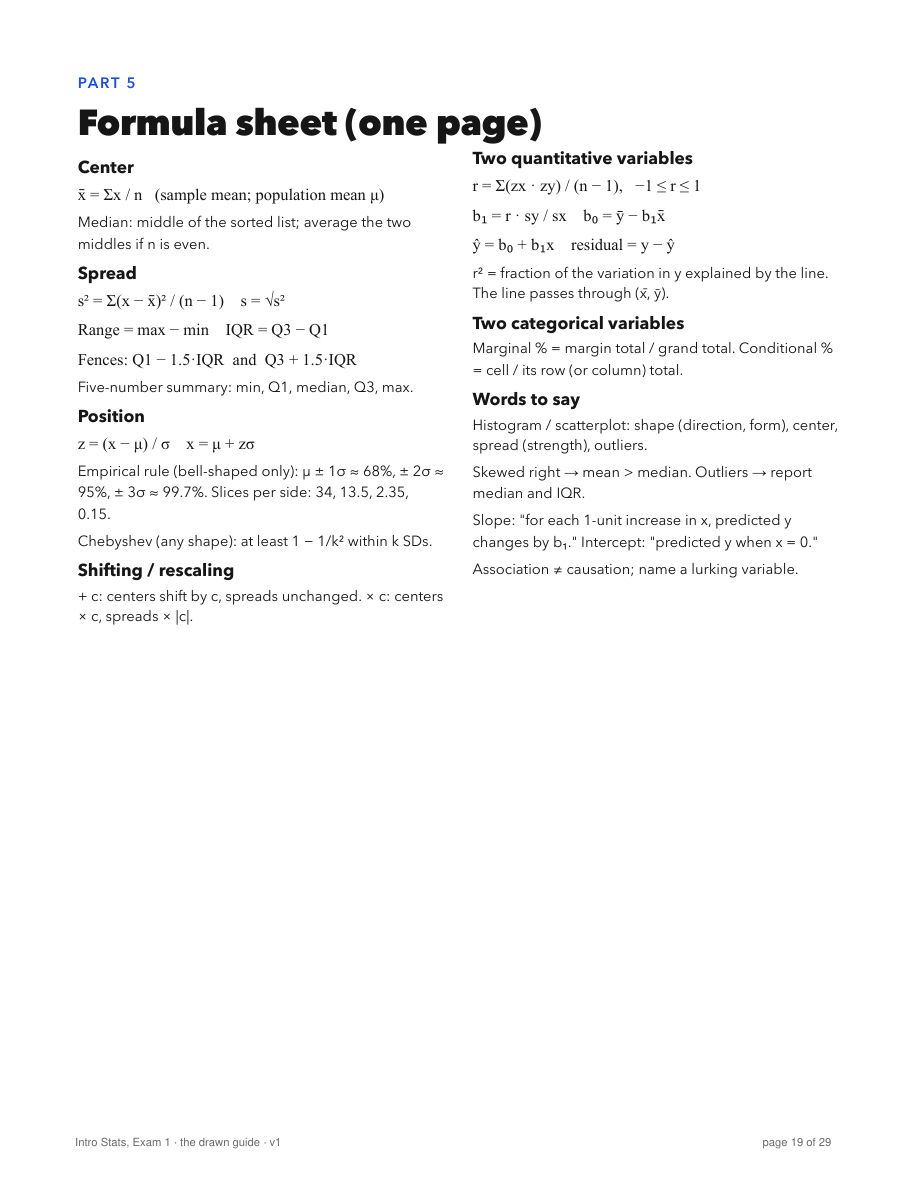
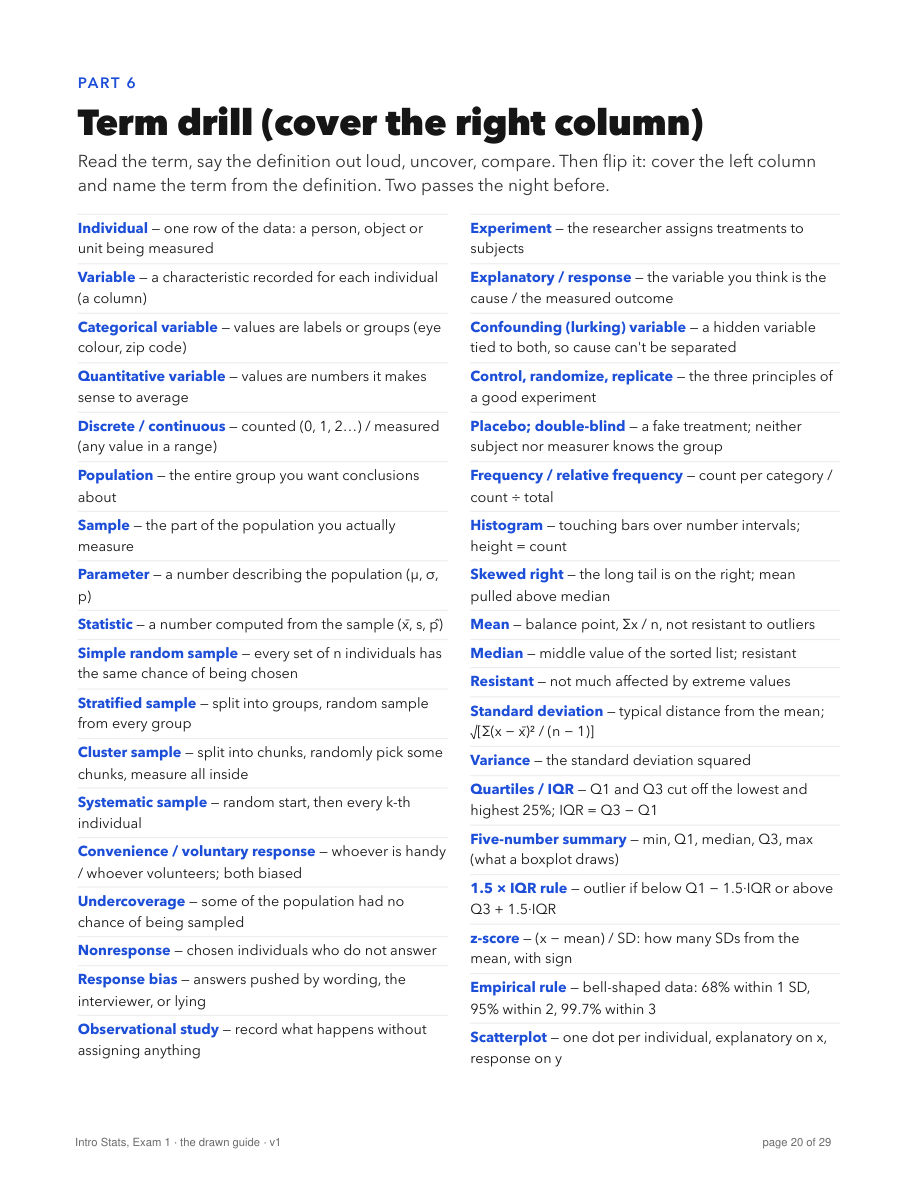
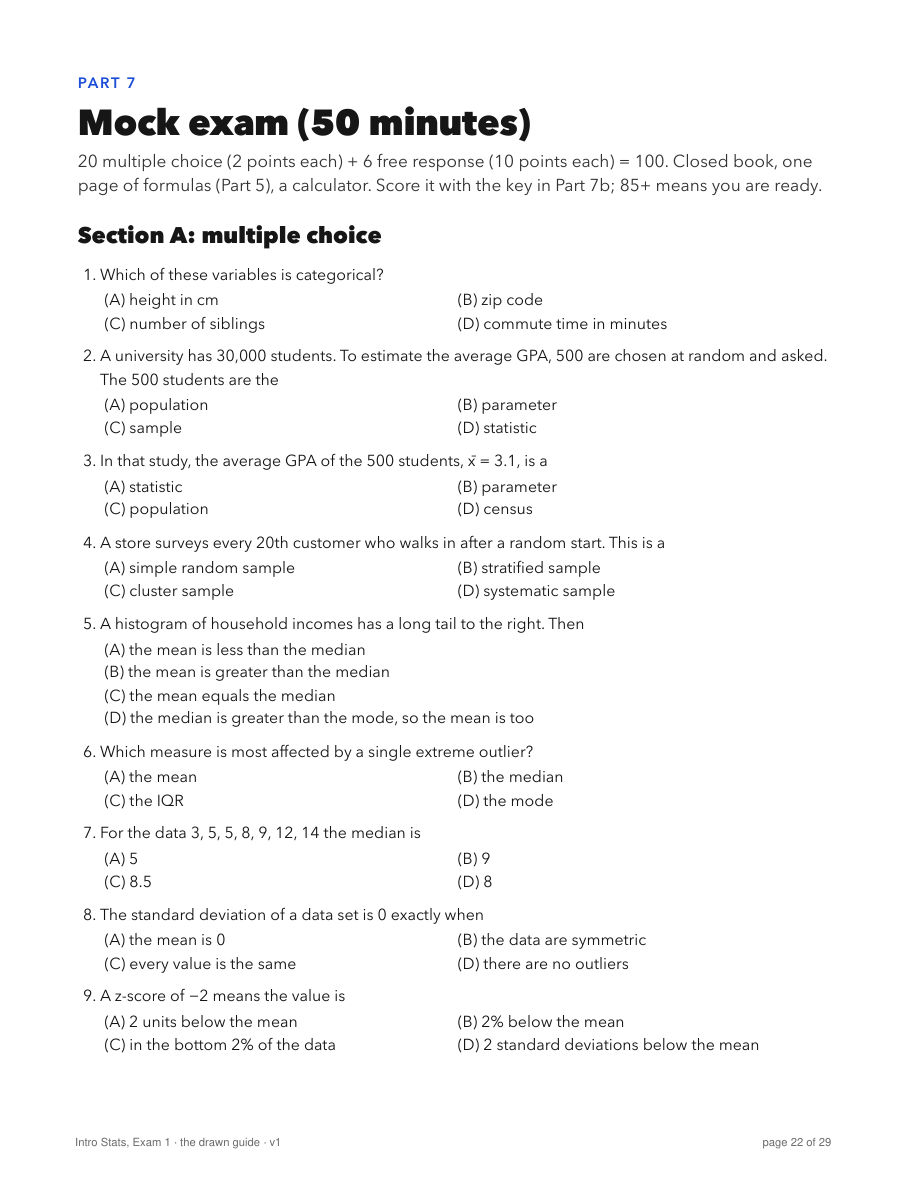
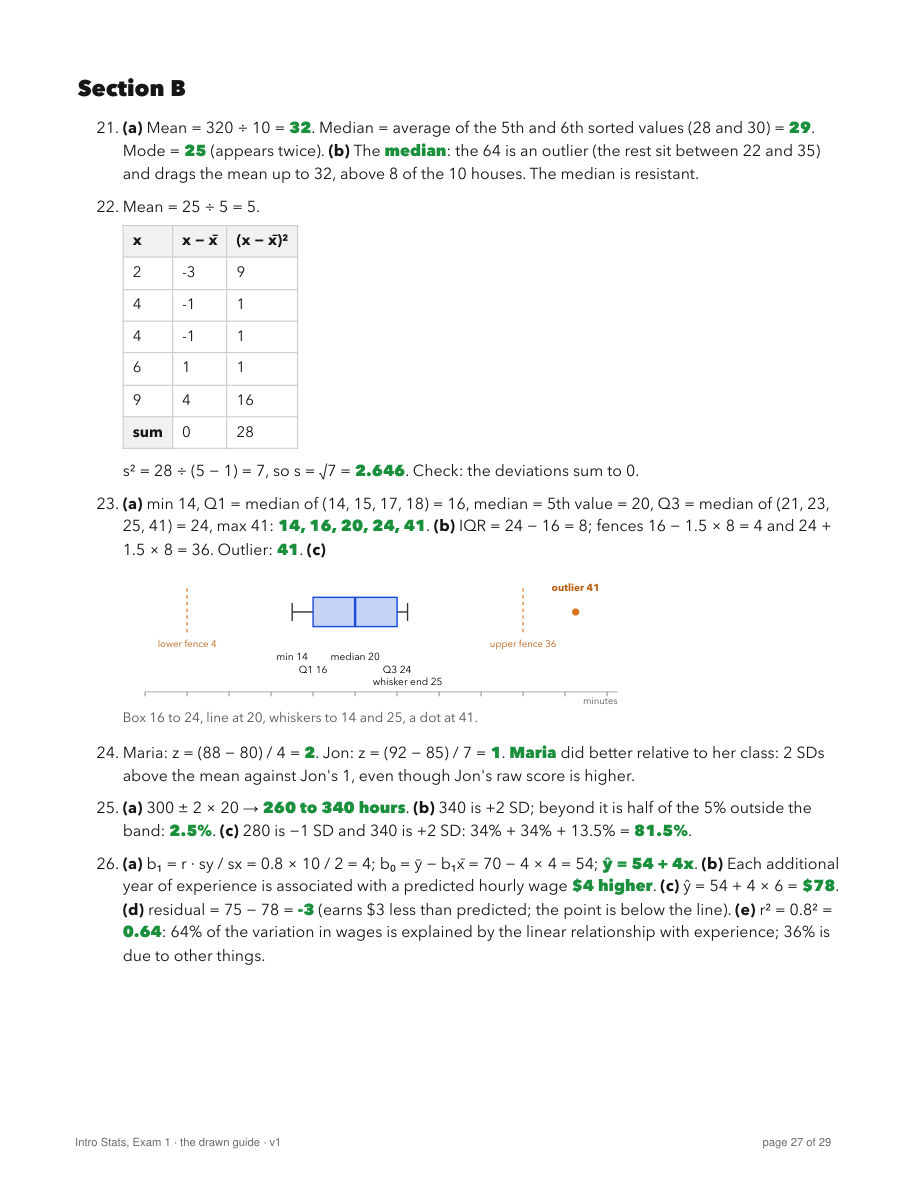
Swipe for all ten →
Read before you pay. Three sections of Part 3, exactly as they are in the guide: standard deviation by hand, z-scores, and the 68-95-99.7 rule. If they make sense to you, the rest is the same, for every topic.
One zip, about 1 MB. Read it on your phone or laptop, print the mock. For your own studies; please don't resell or share the files.
US$15one time
Stripe takes the payment (card, Apple Pay, Google Pay). Right after, you land on your download page with the zip, and Stripe emails your receipt.
Get the guide, US$15It's a download you get straight away, so all sales are final (terms). If the download doesn't work, or you find a mistake, email support@waar.com.hk from the address you paid with. Sold by W A A R LIMITED, Hong Kong.
It's written for the first exam of a typical intro statistics course, the descriptive-statistics block, and not tied to any school, professor or textbook. Check the topic list above (it's page 2 of the guide) against your syllabus before you buy.
Then this guide covers only part of your exam. Probability rules, random variables, the z-table and sampling distributions are not in it.
Part 8 has the key presses for the TI-83/84 and the TI-Nspire CX / CX II (mean, SD, five-number summary, correlation, regression line, plots), plus the Google Sheets and Excel formulas.
Quartile methods really do differ. The guide uses the halves method (the TI-84's, and most intro courses'), and flags where a spreadsheet or textbook would give a slightly different answer. On the exam, use the method your professor showed.
Yes. It runs the six steps from page 11 on whatever you type, in your browser, including the 1.5 × IQR outlier rule. The coffee-cart numbers at the top are page 11's worked example.
Four PDFs in a zip. Read them on any phone or computer; print the mock exam and the formula sheet if you like working on paper.
W A A R LIMITED, a Hong Kong company (Business Registration 59466352). Not affiliated with any university, professor, publisher or calculator maker. Terms, refunds and privacy.